Python实现PCA主成分分析算法
import numpy as np
import matplotlib.pyplot as plt
from mpl_toolkits.mplot3d import Axes3D
data=[[100,53,88,100,40,8],[5,45,80,11,12,13],[15,1,59,18,77,20],[5,55,89,48,8,27],
[47,53,8,76,7,34],[459,7,5,8,49,41],[7,88,563,99,56,88],[8,7,23,10,8,79],
[78,7,77,63,6,3],[0,48,86,5,5,89],[5,8,968,85,7,9],[5,3,56,38,0,1]]
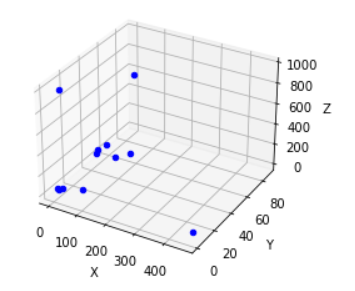
ax = plt.subplot(111, projection='3d')
for i in range(0,12):
ax.scatter(data[i][0],data[i][1],data[i][2], c='b')
ax.set_zlabel('Z')
ax.set_ylabel('Y')
ax.set_xlabel('X')
plt.show()
from sklearn.decomposition import PCA

pca=PCA(n_components=3)
pca.fit(data)
newdata=pca.transform(data)

print(newdata)
print (pca.explained_variance_ratio_)
print (pca.explained_variance_)
[[ -87.42621097   26.52773905    3.58677788]
 [ -89.0591283   -68.88630238  -14.46564889]
 [-111.22400391  -54.83759721  -20.94965039]
 [ -77.47185182  -69.13342624    5.03687181]
 [-161.17530638  -38.79651774   14.00666929]
 [-223.38848375  373.69604841    5.64825871]
 [ 395.02164507   -3.95373951   80.77734095]
 [-146.2453149   -72.47649539   13.59189766]
 [ -98.53322902    3.82366669  -38.71470394]
 [ -82.69819274  -74.49113474   43.63689582]
 [ 793.69496801   49.42649563  -43.96551806]
 [-111.49489129  -70.89873656  -48.18919085]]
[0.81827265 0.14934505 0.01321634]
[86017.07501495 15699.19781904  1389.30526167]
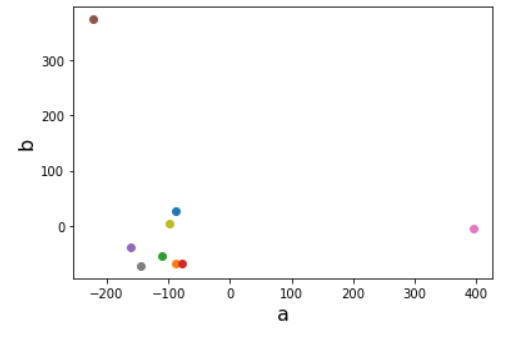
plt.figure()
for i in range(0,9):
    plt.plot(newdata[i][0],newdata[i][1],marker='o')
plt.xlabel('a', fontsize=16)
plt.ylabel('b', fontsize=16)
plt.show()